modbus tools
For test, simulation and programming.
Real time Charting:
Real time Charting help you visual follow value changes in real time.
To open the Real time charting dialog you have 2 options:- Press Alt + R
- Select "Real time Chart" from the Display menu
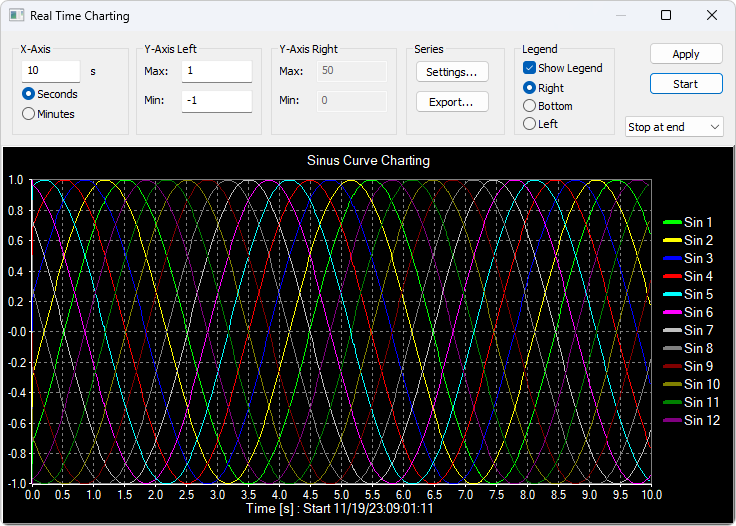
The X-Axis display the number of seconds since the chart was started.
When the points reach the end of the chart there are 3 options:
- Stop at end: The charting stops
- Restart at end: The charting starts all over again
- Continue: It continue until it reach the max number of points or stop is pressed
Press the apply button to apply the changes.
Zoom function
Zooming in on the chart can be useful if you want to see more details. The zoom is controlled with left mouse button. To zoom a specific part of the chart, simply left-click on the chart (this will be the upper-left corner of the zoomed rectangle) and drag to the bottom-right. A rectangle will appear. As soon as you release the mouse button, the axes will automatically adjust themselves to the region you have selected. If you left-click on the chart (like for starting a zoom) but if you move to the top-left corner instead, all the modifications done with the zoom and pan features will be canceled (the chart will be in the state it was before the manipulations with the pan and zoom).Pan function
To pan the control, right-click somewhere on the control and move the mouse. The point under the mouse will follow the movement of the mouse.Link data to the chart series
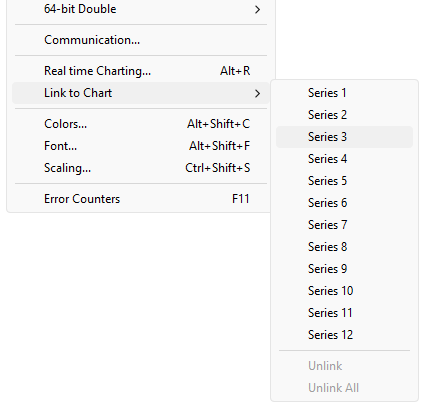
The chart don't know which data to use unless you link a Modbus data cell to one of the 4 series. To do so select a value cell and from Menu->Display select "Link to Chart".